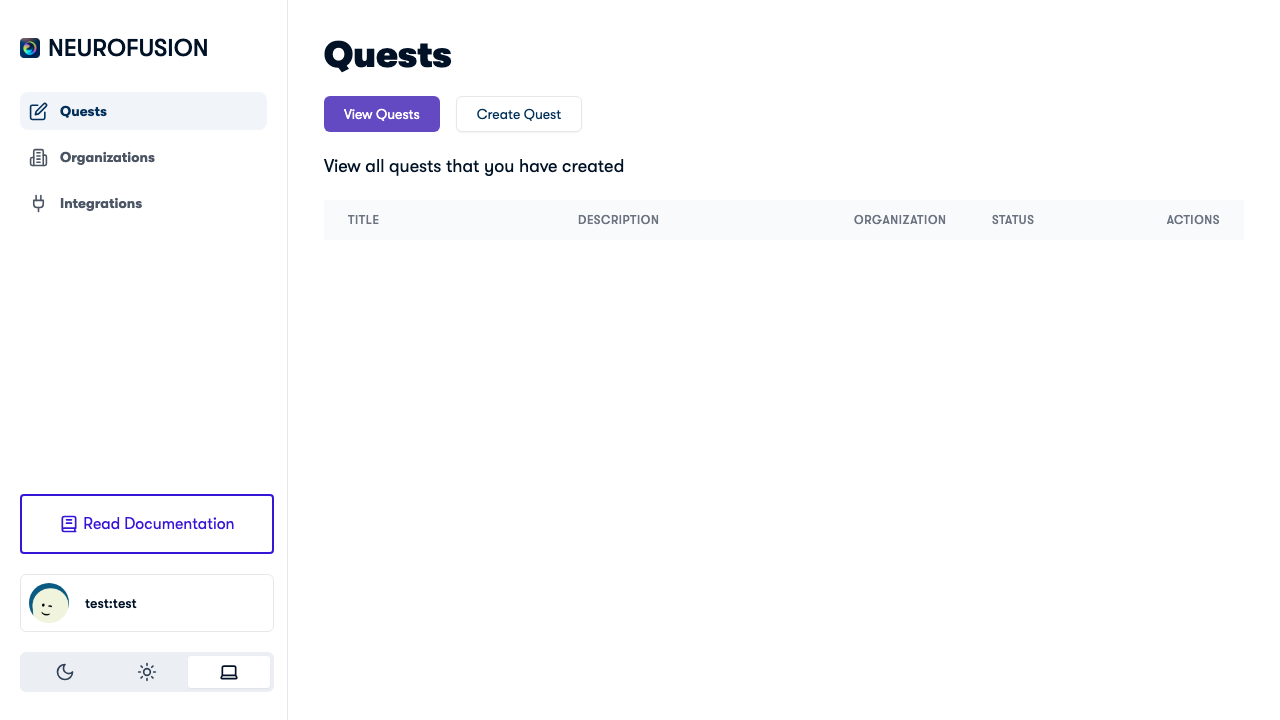
The Quests dashboard showing all created quests with status and actions
Quest Detail Page Overview
The quest detail page shows:- Quest title, description, and status (Draft, Published, or Unpublished)
- Action buttons for publishing, sharing, downloading, refreshing data, and opening participant operations
- Schedule & Compliance for a selected cohort, including baseline / follow-up offsets and due-state summaries
- Participants page for participant roster, cohort assignment, and lifecycle updates
- Participant responses table listing every data submission across all data types
Data Types
All submissions are displayed in a single Participant Responses table with four columns:
The table combines the following data types:
Health data (steps, sleep, heart rate) is displayed separately in a graph view when available, with a category selector to switch between metrics.
Viewing Individual Responses
Prompt & Onboarding Responses
Forprompt_responses and onboarding_responses, click the View data button in the Value column. A viewer panel opens below the action bar showing the response as formatted JSON.
Experiment Trials & Brain Recordings
Forexperiment_trials and brain_recordings, each row shows:
- Dataset name — the experiment name or recording type (e.g., “Stroop Task” or “EEG Recording”)
- View data — opens the data in an inline viewer panel
- Download — downloads the individual dataset as a JSON or CSV file
- URL Parameters (if present) — expandable section showing any URL parameters captured at submission time (e.g., Prolific IDs)
Dataset Viewer
When you click View data on any response, a viewer panel appears showing:- Header — the data type and a truncated user GUID for context
- Content — the full response data rendered as formatted, syntax-highlighted text
- Close button to dismiss the viewer
Downloading All Data
Click the Download Dataset button in the action bar to export all quest data as a single CSV file. The CSV contains the following columns:
The file is named
quest_{questId}_data.csv.
Participant Operations
Use Manage Participants to open the participant workspace for a quest. See Managing Participants for full documentation on the participants page, including:- reviewing joined participants and their lifecycle status
- filtering by cohort and status
- updating participant status (enrolled → active → completed, etc.)
- assigning or removing cohort membership
- API reference for programmatic access
Schedule & Compliance
The quest detail page also includes a compact Schedule & Compliance panel. Use it to:- select a cohort
- save a baseline offset in days
- save a follow-up offset in days
- review whether each participant is
upcoming,due,overdue, orcompleted - mark baseline or follow-up as complete when needed
This panel is intentionally narrow today: it supports baseline and follow-up checkpoints rather than a full visit-calendar system.
Health Data (Graph View)
If your quest collects health metrics (steps, sleep, heart rate), the page includes a graph view showing trends over the past week. Use the category selector to switch between:
Each participant’s data is plotted as a separate series on the line chart.
Vital User Mapping
If your quest is integrated with the Vital API for wearable data, a Get Vital to Fusion User Mapping button appears in the action bar. Clicking it downloads a CSV mapping Vital user IDs to NeuroFusion user GUIDs — useful for reconciling wearable data with participant identities.Refreshing Data
Click the Refresh button to reload all datasets from the server. This fetches the latest submissions without reloading the entire page.Next Steps
Running a Study
Full lifecycle guide including monitoring and export.
Participant Journey
See the participant flow from onboarding to submitted datasets.
Sharing & Publishing
Publish your quest and share it with participants.